
I'm going to demonstrate how to install the free statistical package R and calculate some basic statistics.
Oracle DBAs summarize data all the time. Statistics is a way to quantitatively summarize data. And, the R Statistical Package is 100% free, easy to install and easy to begin using.
I'm convinced that every Oracle DBA needs to be able to install R, calculate a few basic statistics, create histograms and do simple significance tests. In this post, I'm focusing on demonstrating how to install R and calculate some basic statistics.
My Hidden Agenda
Honestly, I have another reason why I am blogging about installing R. In subsequent postings and in my Firefighting Friday "How To" Webinars we are going to use R to better understand wait event times and visually understand Oracle Database session level activity... visually! It's very cool but before I can jump to that level and have you actually do what I do, you need to first install R. So, now you know my hidden agenda!
Let's get started!
How To Install "R"
Installing the free statistical package, named "R" is super simple. While I'll detail the few steps below, you can watch me do it. In the video below you can watch me install R from start to finish! I hijacked the video snippet from my online seminar entitled, Using Skewed Performance Data To Your Advantage .
The first step is to simply go to http://www.r-project.org and you will see a web page similar the image below.

See the above big red arrow pointing to download R? Click that and you will see the below image. There are many mirror sites, scattered all over the world, containing the R software distribution files.

Simply find a mirror you like and click. Then you will be presented with your OS specific download options. Below is what is what it looked like for me.

Click the link to your OS and complete the install just like most software on your OS. It should take no more than 2 minutes to complete the installation!
Compared to installing Oracle Database software, this is brain-dead simple. Even your VP could install it... and may have in their MBA statistics class!
How To Begin Using R
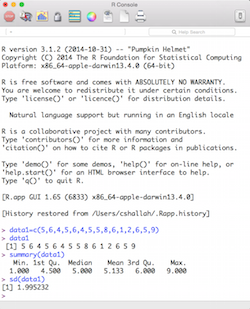
To start the R Console click on the appropriate R icon or executable. On my Mac, the console looks like the below image.

If you see something similar, then you are all set to begin using R! In the sections below, I will walk you through you how to do some super simple statistics.
Get Some Data To Summarize
Now it's time to do something useful. But first you've got to have some data. In my OraPub System Monitor (OSM) toolkit are three tools of particular relevance. To collect wait event times you can use swHistGenV.sql and swgettimes.sql. To collect SQL statement elapsed times use the sqlelget.sql tool. I will be blogging and doing webinars about how to specifically use these tools (and possibly others) in the coming weeks.
And, of course you can just enter some numbers like I did below!
Enter Your Data Into R
Start the R console and enter (not the greater-than sign) your data like I did below:
> data1=c(5,6,4,5,6,4,5,5,8,6,1,2,6,5,9)
> data1
 [1] 5 6 4 5 6 4 5 5 8 6 1 2 6 5 9
>
If R replies with its greater-than sign prompt, your data has now been loaded into dataset data1. Just to ensure the data was actually received by R, below I entered the dataset name causing R to reply with the entire dataset contents.
> data1
 [1] 5 6 4 5 6 4 5 5 8 6 1 2 6 5 9
>
Use R To Summarize Your Data
Now let's summarize the data using three classic statistics; the mean, the median and the standard deviation. First, let's get the mean and median using the summary command.
> summary(data1)
   Min. 1st Qu.  Median    Mean 3rd Qu.    Max.
  1.000   4.500   5.000   5.133   6.000   9.000
Finally, I'd like to know the standard deviation of my dataset. The standard deviation is simply a quantitative way to describe the spread or disperse-ness of our data. A small standard deviation means our data samples are clustered and not spread out all over the place. (...real technical I know...)
To get the standard deviation in R, use the sd command. As you can see below, the standard deviation of our samples is 1.995.
> sd(data1)
[1] 1.995232
It can't get much simpler than that. Even a SQL statement is more complicated! The below image shows all the steps we just went through.
I hope noticed that using R can be super simple. Of course, it can also be very complicated and cryptic at times. But for basic statistics and even some visualizations, it is very straightforward!
This Is Just The Beginning!
In this post, I simply wanted you to install R, enter some data and use R to generate a few numbers to quantitatively describe our data (i.e., statistics). In the next post, I'll show you how to check if your data set is normally distributed and create some cool looking histograms.
Then we'll be ready to take a close look at Oracle performance related activity such as wait event times, SQL statement elapsed times and batch job run times. And, ultimately to graphically represent intense concurrency situations at the session level!
But let's take it a step at a time. Besides, you have other real work to do anyways, right?
Thanks for reading and enjoy your work!
Craig.


