If you have been following my recent posts, you'll know that when splitting our FULL dataset into TRAIN and TEST datasets both the Top Down Split and the Random Shuffle Split strategies produce untrustworthy accuracy score results.
My previous article focused on proportionally splitting our FULL dataset. This stratification ensures our model is proportionally trained and tested, resulting in a valid accuracy score.
However, all is not as we would like.
If we have a relatively small dataset or we have a rare event (imbalanced) situation, then the robustness of our valid accuracy score is not as good as it could be.
One solution to this problem is to creatively use our dataset to produce both a valid accuracy score AND one that is as strong as a much bigger dataset.
The focus of this article is how to maximize training and testing quality by virtually creating a bigger dataset. There are a few ways to do this, but in the article the focus is on what's called, cross validation or K-Fold cross validation.
If you like creative solutions to a pesky problem, then you'll love this article.
How To Create A Bigger Dataset From A Smaller Dataset

This strategy is commonly called cross validation or K-Fold cross validation.
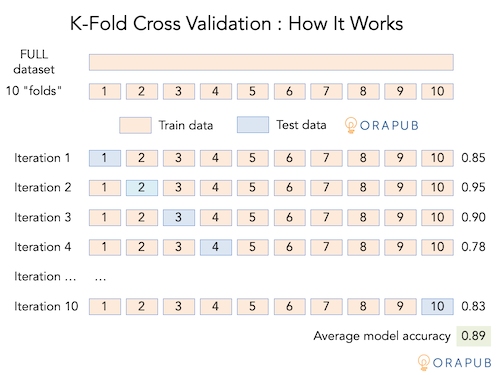
Conceptually, here's how it works. Suppose, your dataset contains 100 samples. Divide these 100 samples into 10 groups, called folds. Each fold is assigned a number from 1 to 10.
Train (i.e., fit) the model using folds 1 to 9, then test (i.e., predict and compare results with actual values) the model using fold 10. This is essentially what we have been doing when splitting our FULL dataset into TRAIN (90%) and TEST (10%) datasets. But we can do better!
Continuing on, now train the model using folds 2 to 10, then test the model using fold 1. Repeat this process until all folds have been a test fold.
Because we create 10 folds, we have created an additional 9 "datasets" resulting in 10 accuracy scores. We can now calculate the average accuracy, plus perform additional data analysis.
Keep in mind that each iteration is a complete model fit, predict and score cycle. Cross validation takes time! The time is dependent on our CPU's power and number of cores, available memory, machine learning model and it's parameters, the amount of data and the number of folds.
Below is a picture representing what I wrote above.
Good: Multiple Folds

Full disclosure. The folds are not simply, "Divide up your FULL dataset into K folds." It's much cooler than that!
If all we want is K folds to have multiple accuracy scores, we can simply use the Python function cross_val_score. This function does both the folding and the scoring.
Here is an example taken from this article's Jupyter Notebook.
# Cross Validation Using Our FULL Dataset

# create/initialize model

from sklearn.tree import DecisionTreeClassifier
model = DecisionTreeClassifier(random_state=123)

# Fold the dataset and score each iteration

from sklearn.model_selection import cross_val_score
scores = cross_val_score(model, X, y, cv=6)

print("Accuracy: avg=%.3f std=%.3f scores=%d" % (np.mean(scores), np.std(scores), np.count_nonzero(scores)))
print("\nIndividual CV scores\n")
print(scores)
Here is the output.
Accuracy: avg=0.715 std=0.039 scores=6

Individual CV scores

[0.75238095 0.72380952 0.7047619  0.66666667 0.77142857 0.66985646]
That's great and also useful, but it's simple to take it to the next level!
Better: Stratified Folds

If you have been following my articles, you know that as Oracle professionals any time we split our data, we always want a stratified (i.e., label proportional) split.
It's because our data is usually imbalanced, meaning we have a rare event situation which, can lead to the rare "poor performance" samples not being evenly spread across all the splits.
The Python function StratifiedKFold defines our cross validation strategy. The strategy can then be used in another function. For example, the cross_val_score function has a parameter named, cv. The cv parameter receives our cross validation strategy definition. You will see this parameter in many functions that are "cross validation aware."
Here is an example taken from this article's Jupyter Notebook.
# Stratified K-Fold Cross Validation Using Our FULL Dataset

# create/initialize model

from sklearn.tree import DecisionTreeClassifier
model = DecisionTreeClassifier(random_state=123)

# Define our stratified K-Fold CV strategy

from sklearn.model_selection import StratifiedKFold
skf = StratifiedKFold(n_splits=5)

# Score each iteration using our stratified K-Fold strategy

from sklearn.model_selection import cross_val_score
scores = cross_val_score(model, X, y, cv=skf)

print("Accuracy: avg=%.3f std=%.3f scores=%d" % (np.mean(scores), np.std(scores), np.count_nonzero(scores)))
print("\nIndividual CV scores\n")
print(scores)
Here is the output.
Accuracy: avg=0.733 std=0.039 scores=5

Individual CV scores

[0.74206349 0.71031746 0.73412698 0.79761905 0.6812749 ]
The folding is great and the stratification is awesome! But there is yet another level of awesomeness!
Best: Repeat The Entire Process With A Different Starting Point

Stratified folds are awesome, but there is more! The way we diagram the folds makes it easy to conceptualize the folding. But it's actually not that simple. Our dataset is not simply spread out in a linear line and then the line chopped up into K folds.
In reality, folds are more like buckets. The folding process randomly picks a sample and puts it into a fold using a round robin strategy. However, when the fold samples are stratified, it's obviously even more interesting.
Did you notice I just mentioned the word, random?
You may be wondering, "How are the samples selected?" They are randomly selected, which means we can alter the random selection process by setting the random seed and then running the entire process over and over again.
But Python has a function to do this for us!
This process is called, Repeated Stratified K-Fold Cross Validation or something similar. The function name is RepeatedStratifiedKFold, which tells us what we need to know: Repeated, Stratified and Folded!
Here is an example taken from this article's Jupyter Notebook.
There are three key things to notice in the below code snippet.
First, notice I set the random_state to 1 in the RepeatedStratifiedKFold function. Setting this ensures I always get the same repeated stratified fold results. This is great for both demos and real work.
Second, notice in the RepeatedStratifiedKFold function, I set the number of folds to 10 and the number of repeats to 3. Then notice the number of accuracy scores that were created. Remember, each iteration is a complete model fit, predict and score cycle. Five hundred iterations may sound awesome, but the time to complete 500 iterations may not be worth our time or money. I present some iteration guidelines below in this article.
Third, notice the n_jobs parameter in the cross_val_score function. As the number of iterations increase, so does the operation's run time. As an Oracle professional, you know one solution is to parallelize the operation... and that is what the n_jobs parameter allows us to do. You can set this value to the number of CPU cores that can be used or simply -1 to use all cores! Play around with this value and you'll notice the difference parallelization can make.
Here's the code:
# Stratified & Repeated K-Fold Cross Validation Using Our FULL Dataset

# Trained model is tested with data it has never seen before... good
# Train/Test split was performed randomly... good
# Label proportions are maintained... good for rare events (imbalanced sets)
# Multiple TRAIN/TEST scores using a single FULL Dataset... good
# Hold-out (validation) dataset not used... ok sometimes
# Sample level prediction accuracy analysis not used... bad (especially for imbalanced sets)

from sklearn.model_selection import RepeatedStratifiedKFold
from sklearn.model_selection import cross_val_score

# create/initialize model

from sklearn.tree import DecisionTreeClassifier
model = DecisionTreeClassifier(random_state=123)
#
#from sklearn.ensemble import RandomForestClassifier
#model = RandomForestClassifier(random_state=0,n_estimators=100)
#
#from sklearn.svm import SVC
#model = SVC(class_weight='balanced')

# Define our repeated stratified K-Fold CV strategy
cvStrategy = RepeatedStratifiedKFold(n_splits=10, n_repeats=3, random_state=1)

# Evaluate the initialized model using our cross-validation strategy
scores = cross_val_score(model, X, y, scoring='accuracy', cv=cvStrategy, n_jobs=-1)

print("Accuracy: avg=%.3f std=%.3f scores=%d" % (np.mean(scores), np.std(scores), np.count_nonzero(scores)))
print("\nIndividual CV scores\n")
print(scores)
print("\nLabel Counts And Percentages (FULL Dataset)\n")
labelStats(y)
Here is my output.
Accuracy: avg=0.747 std=0.033 scores=30

Individual CV scores

[0.73809524 0.74603175 0.73015873 0.77777778 0.75396825 0.72222222
 0.71428571 0.73015873 0.75396825 0.744      0.77777778 0.75396825
 0.70634921 0.73015873 0.77777778 0.65873016 0.76190476 0.75396825
 0.75396825 0.744      0.80952381 0.78571429 0.72222222 0.84126984
 0.71428571 0.73809524 0.74603175 0.70634921 0.76190476 0.76      ]
Did you notice there are 30 individual accuracy scores? It's because each fold iteration produces a score (10) and the entire process is repeated (at a different starting point) three (3) times. As a result, we have 30 scores.
How many repeats should I use?
The "industry standard" is 10 folds with 3 repeats. If you mess with the numbers a bit you'll notice that as number of scores increases, the accuracy score converges on the "true" accuracy score. With 10 folds and 3 repeats, the average accuracy score will be pretty much what will be even if you increase the number of repeats.
For example, in the above code snippet, I increased the number of repeats from 3 to 30, resulting in 300 scores, with an average accuracy result of 0.743. With only 3 repeats, the average accuracy was 0.747. For our purposes, there is no significant difference with increasing the number of repeats. But, I usually do a little, just to be sure!
Is there a fold upper limit?
The number of folds does have an upper limit. Each fold must have enough samples to be a viable test. You will know when the limit is hit, because the Python function will either error out or display a warning.
Personally, since I work with a lot of smaller and rare event datasets, it is easy to hit this limit. So, if you do, just reduce the number of folds. And, if you want more total scores, increase the number of repeats.
Better Than Best?

If you think back to my previous articles, we have come a long way. We started with calculating a single accuracy score based on the FULL dataset. Which is completely worthless. In this post, I introduced repeated stratified K-fold cross validation. Wow, we've come a long way!
Is there yet another better way to determine a model's accuracy?
Well, it depends on who you talk with. I think it really depends on someone's experience and the type of datasets they have worked with.
Most data scientist are happy with repeated stratified K-fold cross validation, using 10 folds and 3 repeats.
Personally, with the datasets I work with, I need to go a step further. Actually, I need to go two steps further.
The next step is to use what's called a "hold out" or "validation" dataset, which is basically a final test, after you feel your model is ready to be deployed.
The second next step is to check to ensure you do NOT have a situation where most of the common "good performance" predictions are correct and most of the "poor performance" predictions are wrong. Using a simple accuracy score, like we have done, we can not determine if the accuracy scores are the same for both "good" and "bad" performance situations. Ouch!
In my next article, I'll focus on how to use a "hold out" or "validation" dataset. It may seem simple, but it's not and, you have to be very careful or your accuracy score will be flawed.
All the best in your machine learning work,
Craig.


